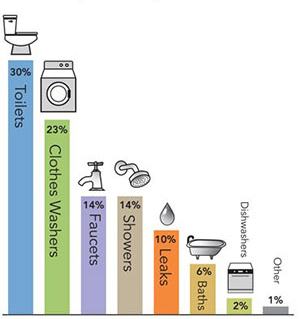
Water Consumption GraphJuly 16, 2015/by Green Coast Rubbish https://www.greencoastrubbish.com/wp-content/uploads/2026/05/gcr-20.png 0 0 Green Coast Rubbish https://www.greencoastrubbish.com/wp-content/uploads/2026/05/gcr-20.png Green Coast Rubbish2015-07-16 05:34:252015-07-16 05:35:22Water Consumption Graph